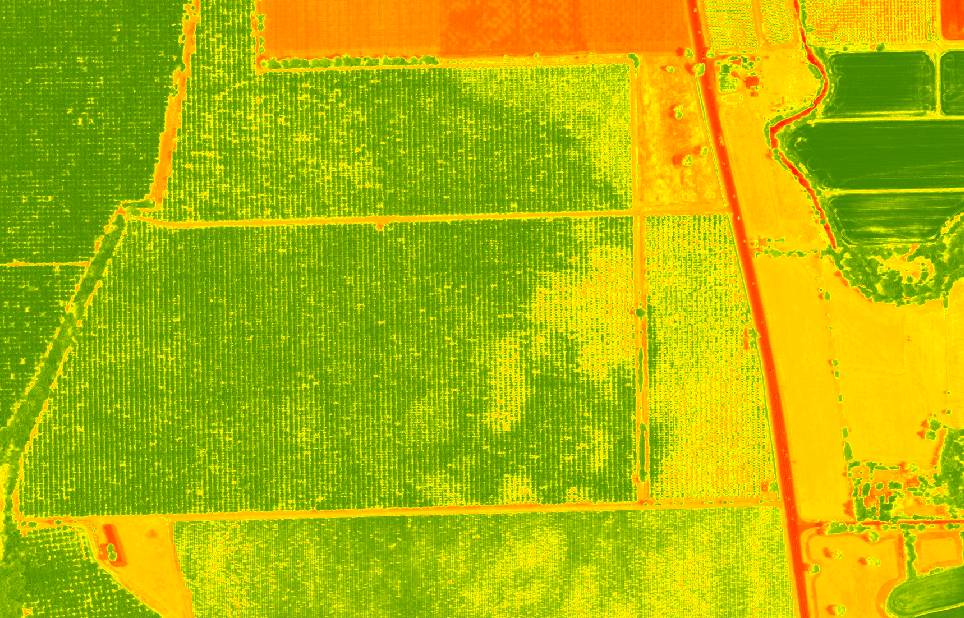
Like most Californians we have been watching the reservoir levels drop, and wondering what we can do to help farmers make do with less water. We are working with some of our contacts in the wildfire world to develop mapping techniques that analyze aerial imagery to map drought-related stress in orchards and field crops. Here are a few example images in which we analyze infrared aerial photos to create an ‘NDVI’ image. NDVI stands for ‘Normalized Difference Vegetation Index’ – it is a common way to measure the amount of photosynthesis occurring in a plant.

Walnut Orchard off of Highway 70 at Lower Honcut Road. Greener colors are healtier trees.

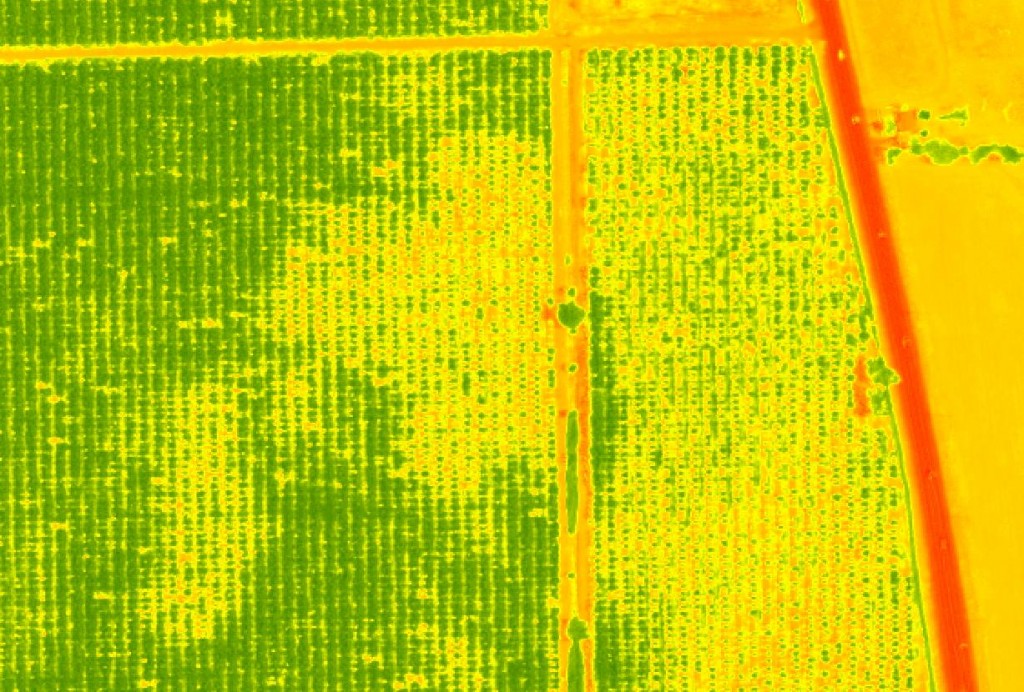
Closer view of the walnut orchard. Yellows and oranges are weaker, more stressed trees.

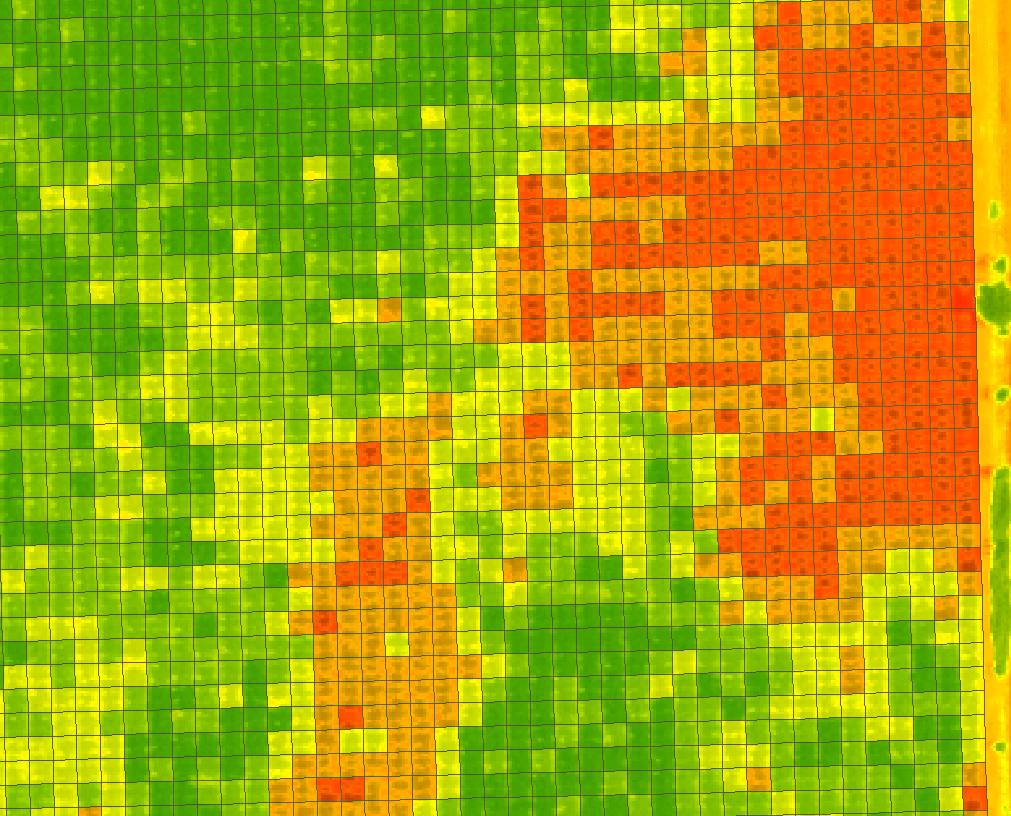
Here we have created a grid of 30′ square polygons – each polygon represents one tree.

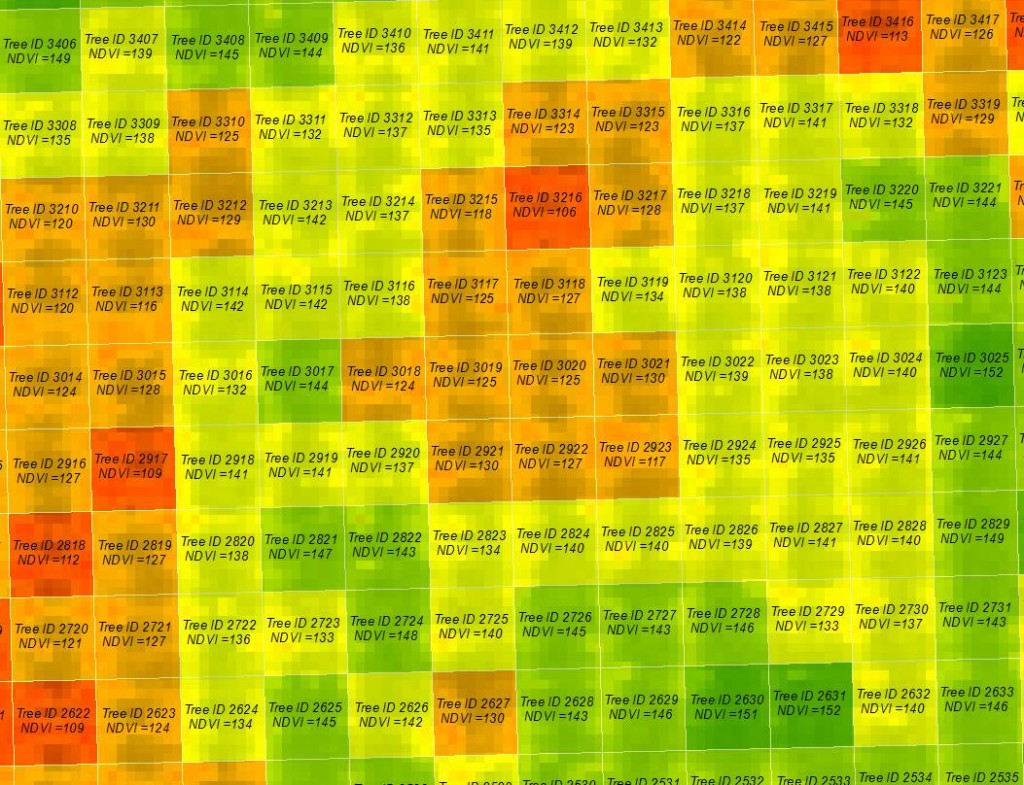
For this image, we have calculated the average NDVI value for each polygon, and assiged a unique ID to each tree. This information can be used to develop custom nutrient/fertilizer and irrigation prescriptions for each tree.