DCR specializes in crisis communications. We work onsite for interagency incident command teams during disasters, where we create maps and graphics to help inform and manage the response. Our teams use maps, field observers and other intel sources to present a holistic view of the situation, and we work alongside government mapping specialists to put the most current information into map form. As situations change, we are prepared to rapidly adapt and respond to new information.
We produce a wide variety of maps on each assignment, including air operations, public information, fire progression, land ownership, briefing, evacuation area maps, and a daily 11″×17″ atlas for crew leaders working in the field.
During wildfire season, we design and print hundreds of maps ranging from tactical topographic maps showing firelines, drop points, safety zones and helispots, to public information maps showing destroyed structures or infrastructure damage. Our maps are used to brief firefighters, help decision-makers navigate complex spatial problems and inform the public.
Since 2011, we’ve sent GIS crews to over 160 emergencies throughout California, Idaho, Oregon, Arizona, New Mexico and Texas. These are mostly fire incidents, but we also assist with Prescribed Fire Training Exchanges (TREX) and also assisted with the Oroville Dam crisis in 2017. We’ve mapped many of the largest, deadliest and most destructive fires in California including:
- August Complex (2017)
- Dixie Fire (2021)
- Mendocino Complex (2018)
- SCU Lightning Complex (2020)
- Creek Fire (2020)
- North Complex/Bear Fire (2020)
- Thomas Fire (2017)
- Cedar Fire (2003)
- Zaca Fire (2007)
- Carr Fire (2018)
- Camp Fire (2018)
- Caldor Fire (2021)
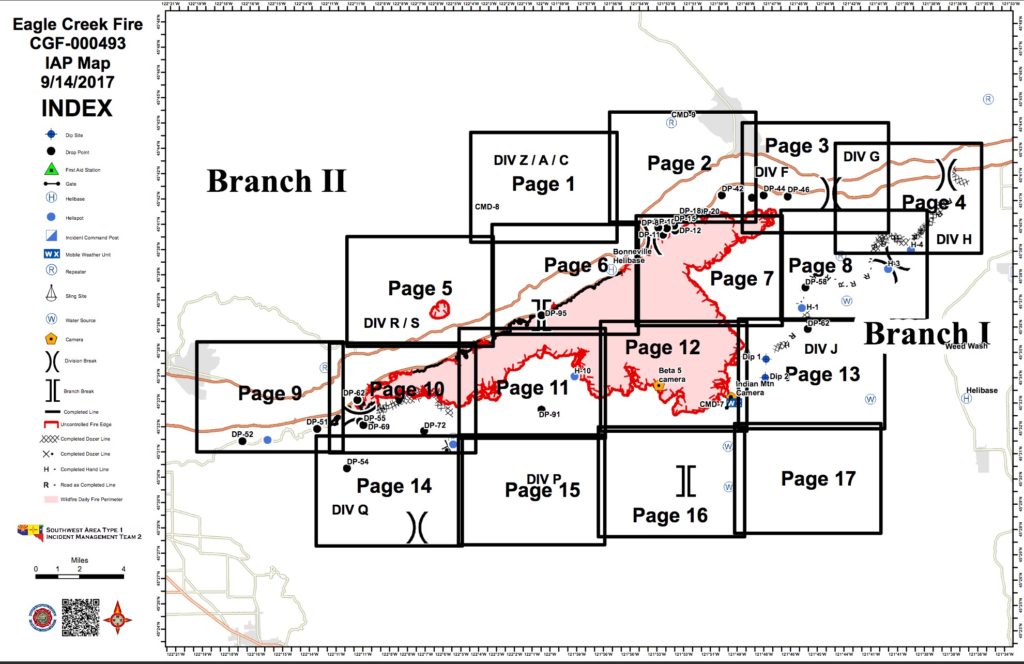
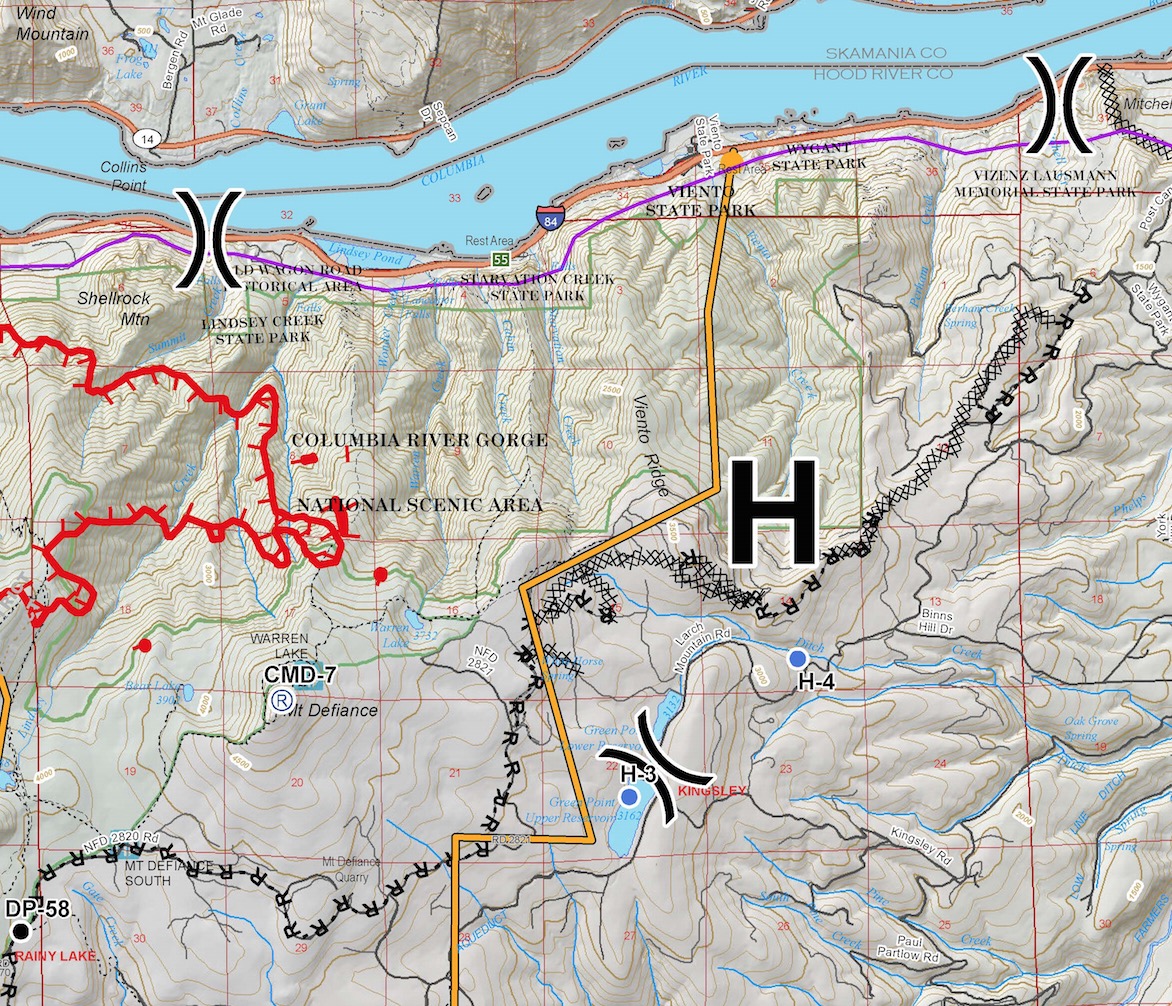
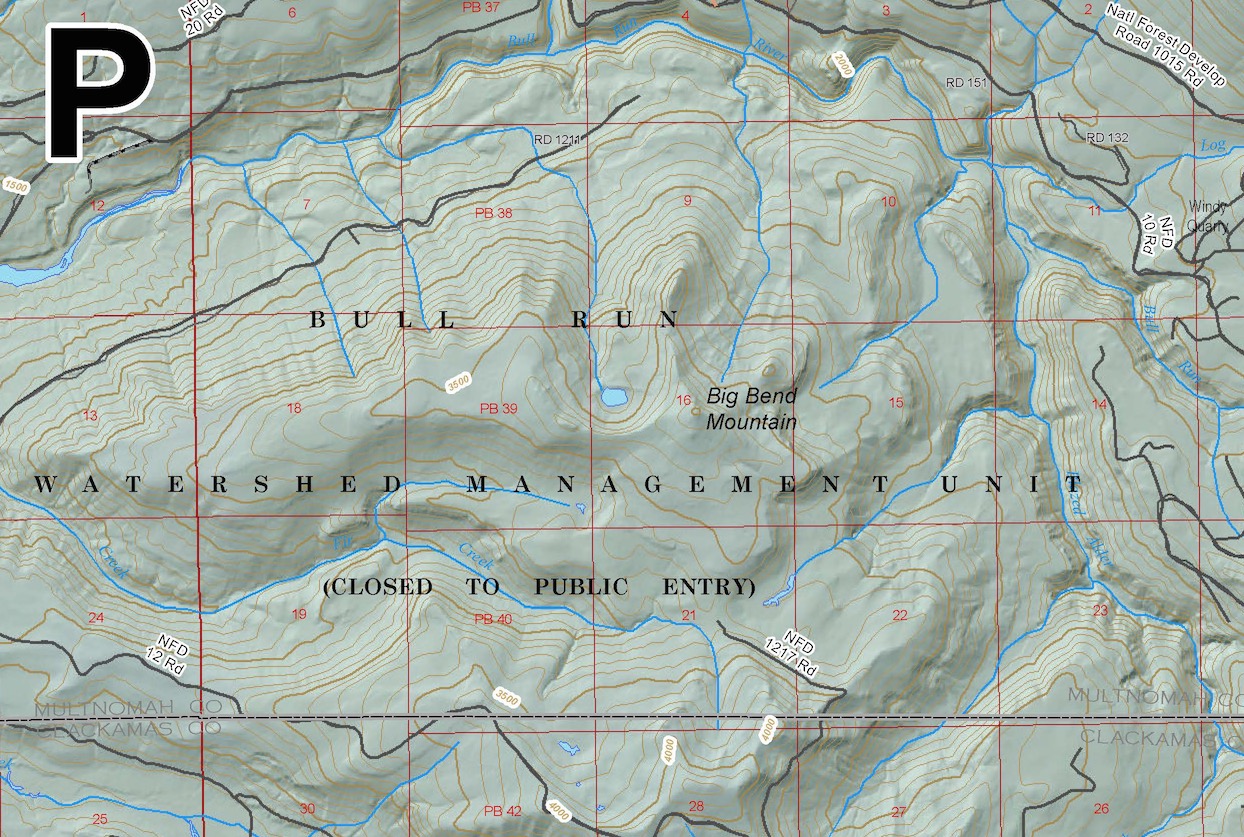
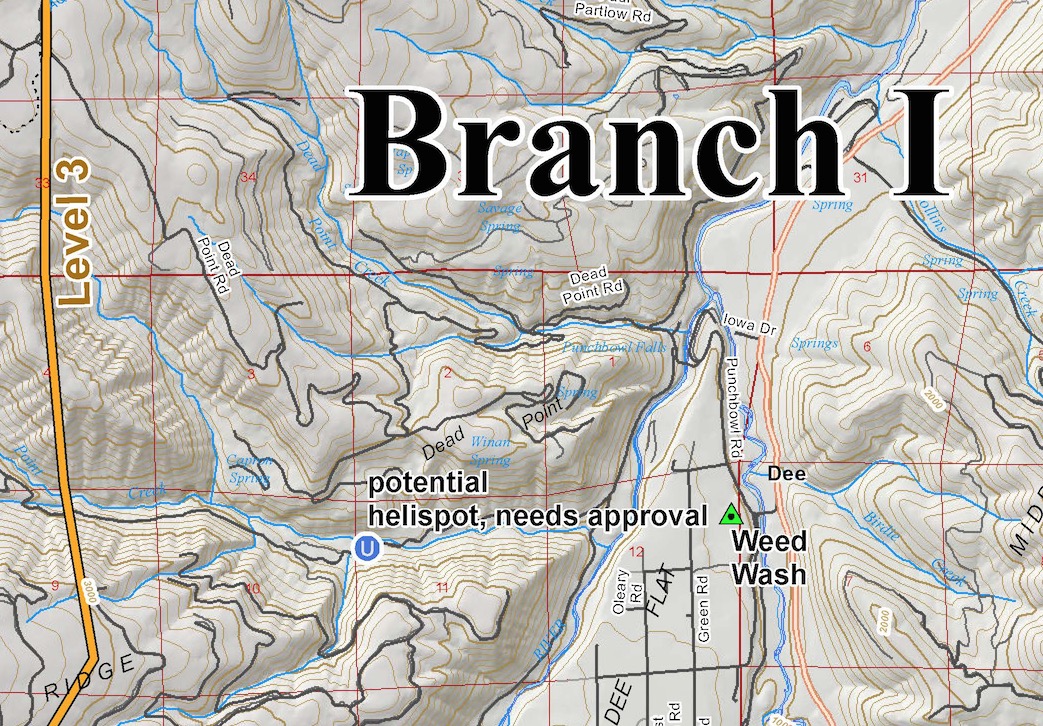
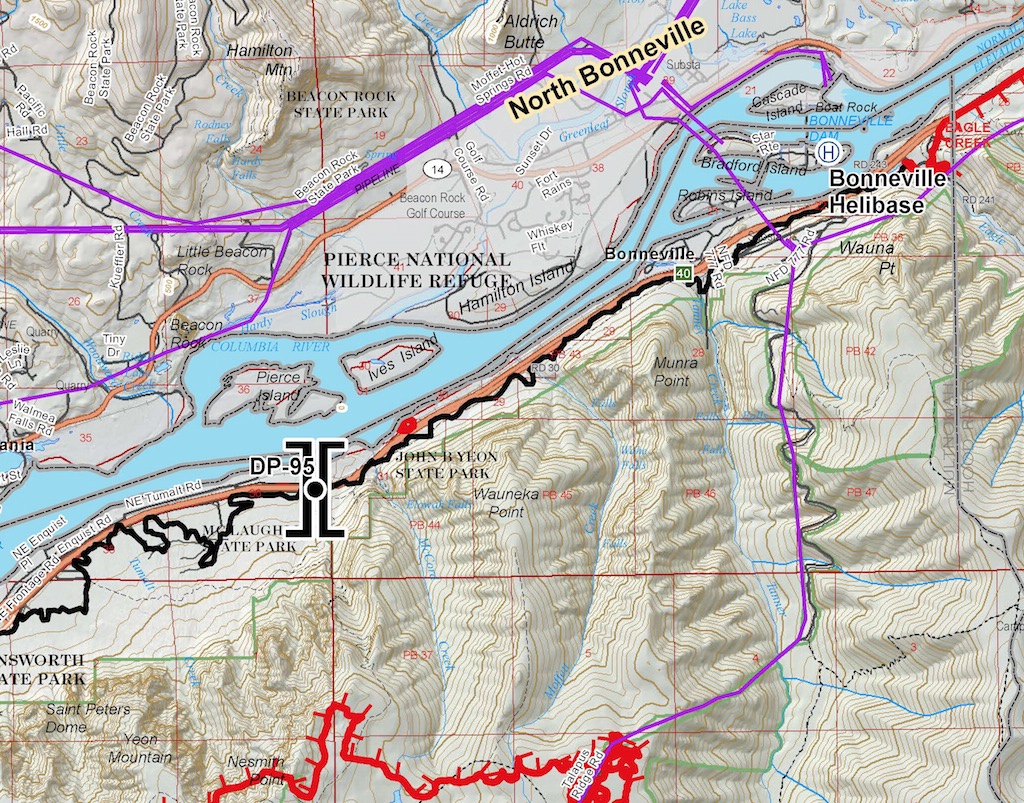
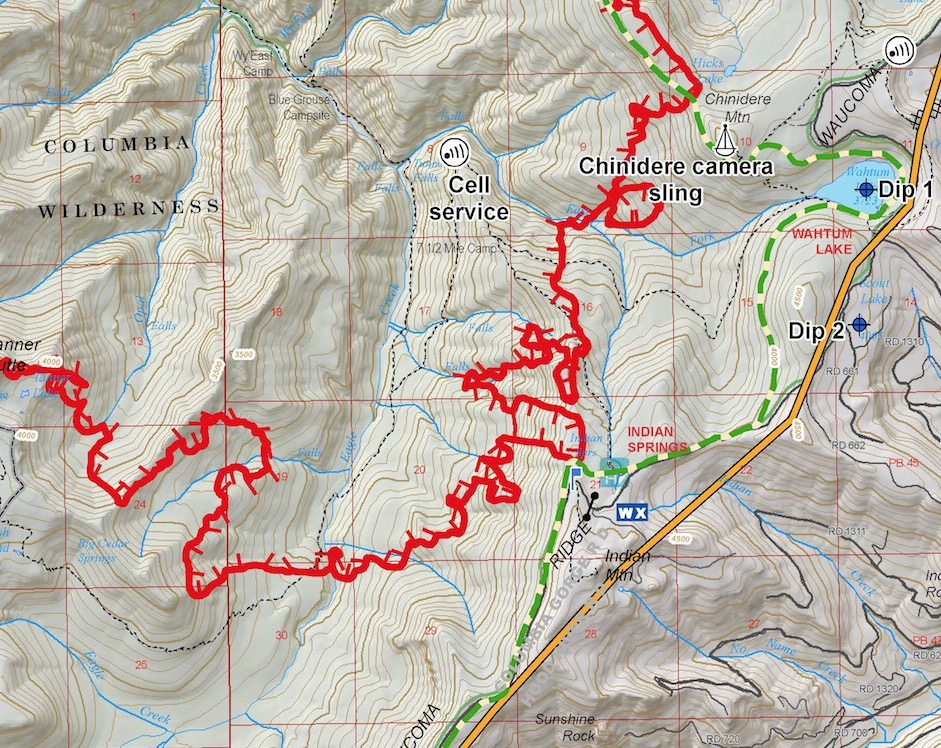
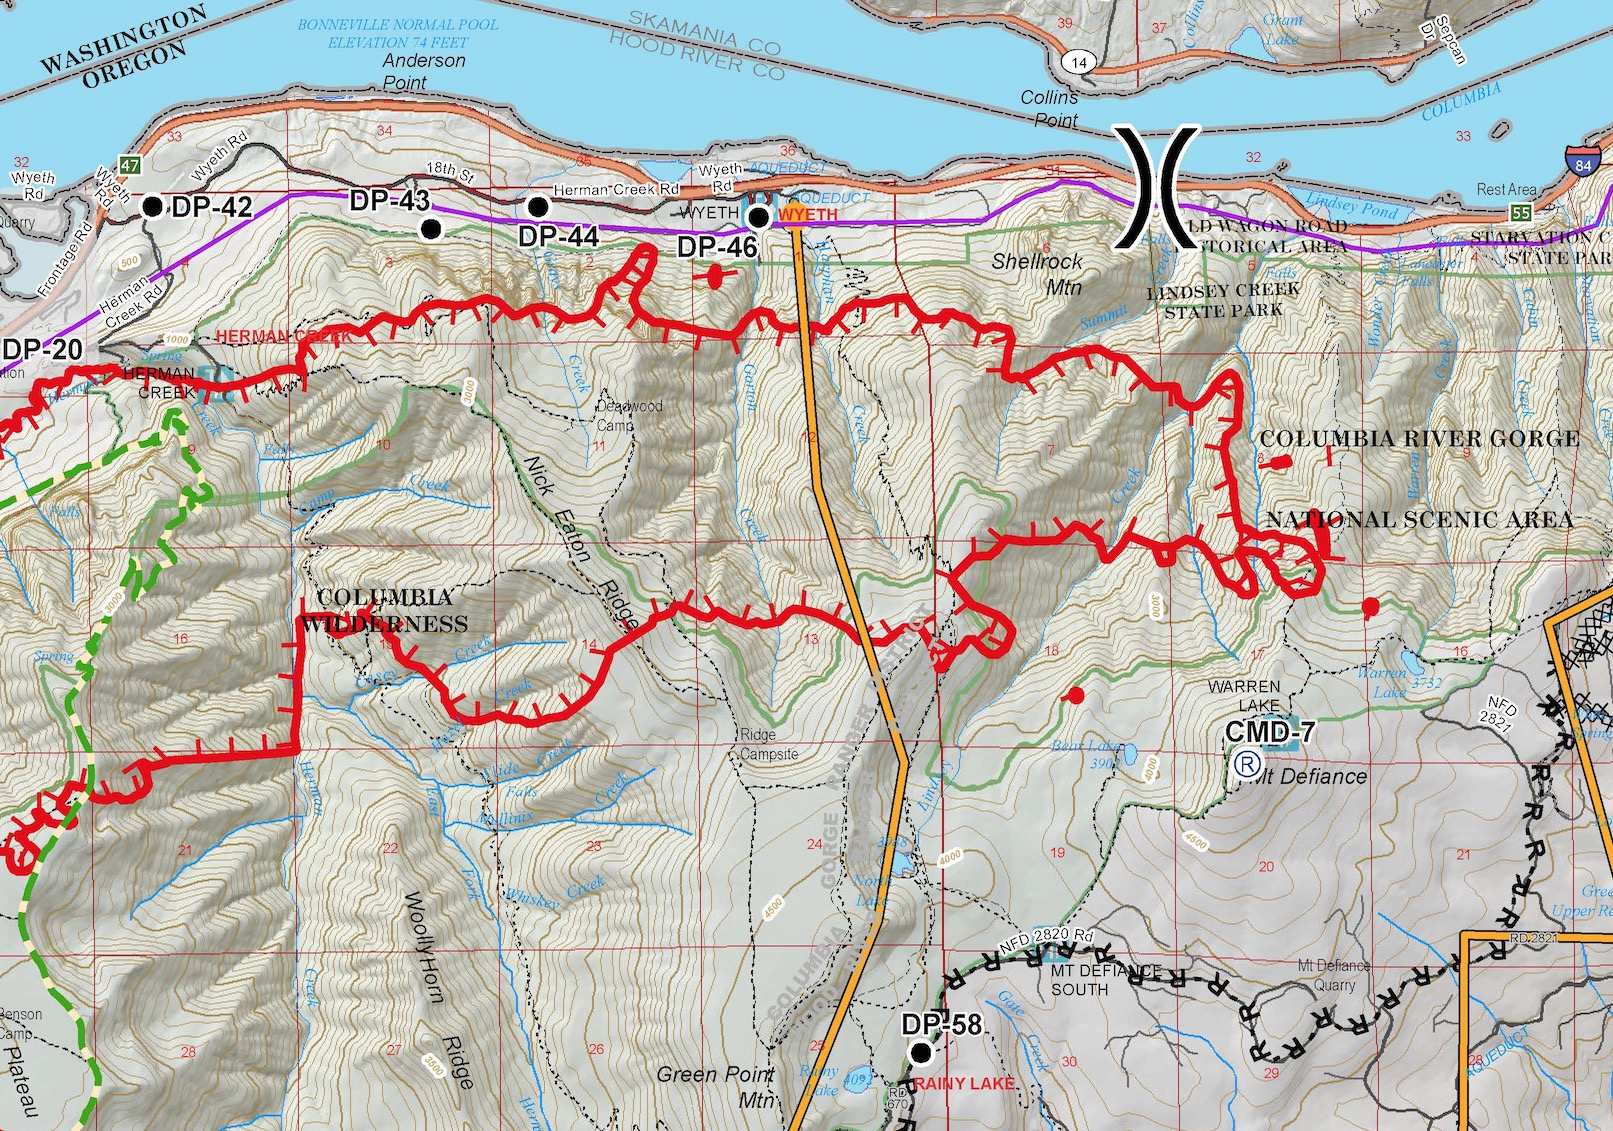
Some jobs provide unique opportunities to test our cartography skillset and the 2017 Eagle Creek Fire, which burned in the Columbia Gorge east of Portland. There is an amazing amount of infrastructure, recreation and topography packed into the fire area, which made for interesting map-making.
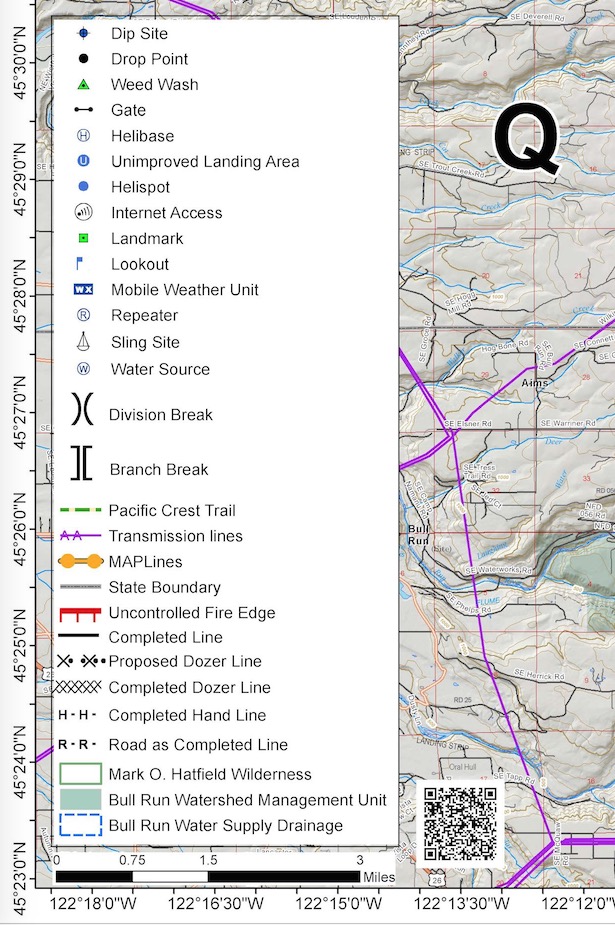
Here are a few images from the main operations map, produced each day on this fire. We designed this basemap using a variety of data compiled from public sources over the years. The incident command team was responsible for gathering, vetting and updating the various firelines and other fire-specific overlays such as drop points, water sources and other points of tactical significance.
